8.6 Adding Charts and Graphs to Your Reports
Sep/1/2007
Tradepoint includes a Charts wizard
to give your Reports extra impact with the visual graphic of your data in a
variety of possible graphs. This tool is espacially effective when
used with the Business Analytic Reports found in the My Business
Section.
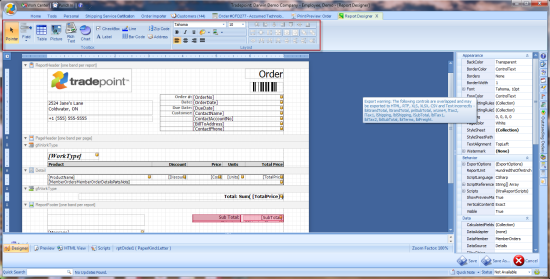
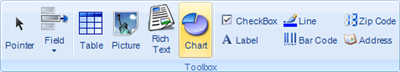
To add Analytics charts to your reports
choose the Charts icon from the toolbar.
When you click on the Chart icon the Charts
wizard will open with the options for preference for your chart within your
Report.
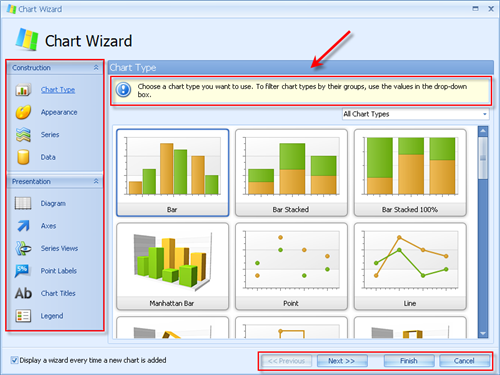
The type of Chart as well as other
preferences relevant to its presentation are available through the toolbar on
the left. As you specify your choices the prompts on the lower right will ask
you for information specific to the Analytic Chart you have chosen for your
Report.
Preferences for your Chart
include:
- Chart Type (what kind of Chart)
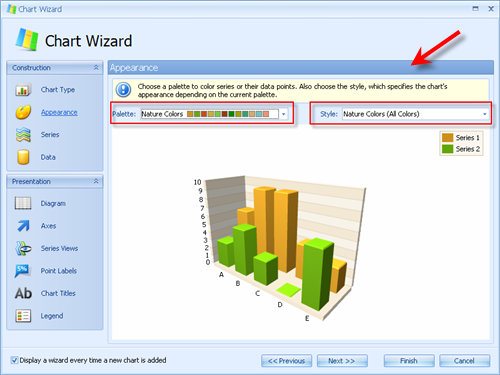
- Appearance (colors, layout and
background)
- Series (the qualities of your data that
you want displayed such as date/time or numerical)
- Data (which data you want displayed from
your Report)
- Diagram (add specific labels for each
series of data in your chart)
- Axes (specify the X or Y Axis that you
want shown in your Chart)
- Series Views (Customize a Series view of
your data such as the width of bars in a Bar chart of change the color of one
series in your Chart)
- Point Labels (Create and highlight
labels you want highlighted in your Chart)
- Chart Titles (Create a Title for your
Chart in your Report)
- Legend (Create a Legend outlining the
data your are illustrating in your Chart)
Each of the windows in the Chart wizard
does give graphic detail of each step in defining your chart and Tips and Tricks
highlighted in the top section of the window shown in teh Appearance screen
below.
The User Guide found on the Support Section
of our website provides specific examples of different types of Charts that can
be added to specific types of Reports.
Related Articles
<Articles>