8.9 Style Sheet Settings for Your Reports
Oct/2/2007
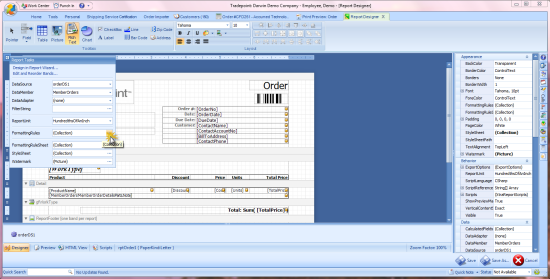
Style Sheet Settings allow you to
define how your information is displayed on your reports. The small arrow you
see circled in the upper left hand corner of the example below with the drop
down menu showing is the tool that will allow you to edit your style sheet. The
style sheet built into the Reports Designer will allow you to modify/add the
following elements in your report:
Bands
Watermarks
Header
Fields
Odd table fields
Even table fields
Fonts
Font Width
Font
Type
Font Style
Borders
Background colors
There are two ways to access the design
tool. One is by the main menu in the upper left corner of the design
window.
You will see several fields light up in the
tools listed on the right hand side of the screen. The particular field that
manages the Style Sheet for your Reports. The arrow highlighted above opens a
menu allowing you to add elements such as a Watermark to the background of your
reports as well as a wizard to walk you through a step by step process of
defining the style of your reports.
Reports
Wizard-This wizard will walk you through a step by step process to
define different elements of style in your report. When you have finished Save
the changes or Save the report as an alternate to the existing Template and give
it a new title to distinguish it from the original Template. (A detailed article
will explain the function of the wizard in the Support
articles)
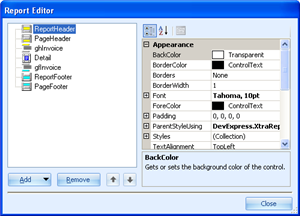
Bands-Clicking on the far right of this
field will open a menu where you can manage the styles, colors and additional
details of the bands within your reports. An example of the menu for this
functions is shown below.
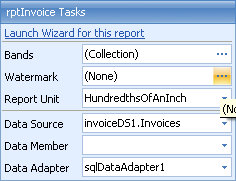
Watermark-Add
a Watermark to your report with this tool. It is similar to adding a logo or
Image and will automatically generate a watermark in the background of your
report. Often companies will use a logo or image indicating the type of report
for a Watermark.
Report Unit-The report Unit is the
unit of measurement used in the customize tool of reports. this is set to a
default and is often not something that needs to be
adjusted.
Data Source-This icon will show which
data set is being pulled into this report. Most people will not need to adjust
this setting in everyday type of customizations.
Data
Member-This icon will show which data type set is being pulled
into this report. Most people will not need to adjust this setting in everyday
type of customizations.
Data Adapter-This icon will
show which data set adapter is being pulled into this report. Most people
will not need to adjust this setting in everyday type of
customizations.
Clicking on the highlighted field on the
right side of the screen shown in the example below will open a menu allowing
you to specify details about the style sheet of your report. The menu is shown
below.
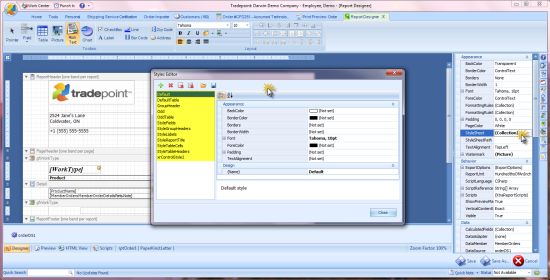
Clicking on any of the items listed on the
left will open the respective fields on the right. Then clicking on the
respective section for details on the right will open additional options to
specify the properties of each element in the report. Below is an example of the
menu for the color of the background of Odd/Even fields displayed in a table of
data within an Invoice.
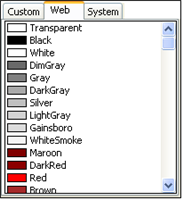
In this case you will be able to choose
from three different menus of color palettes to specify the background color of
an odd/even data table.
These are some of the tool in the Customize
section of the reports. See related articles for further illustrations of
the in-depth functionality built into Tradepoints Reports
Designer.
Related Articles
<Articles>